Rent vs Buy Calculator
Use our free Rent vs. Buy Calculator to compare the total cost of renting versus buying a home. Factor in mortgages, property taxes, rent growth, and investment returns to make the smartest financial decision for your future.
Your Numbers
What is This Tool
Everyone has an opinion on renting versus buying, but almost nobody runs the actual numbers before making the call. This calculator does. Plug in your rent, the price of the home you are considering, your down payment, and your mortgage rate, and it will show you exactly when, or if, buying starts to come out ahead financially.
What sets this apart from most rent-vs-buy tools is that it does not ignore what happens to the money you are not spending. If you keep renting instead of buying, that down payment does not just sit in a savings account, it can be invested and grow over time. Most calculators skip this piece entirely and end up comparing two very different situations as if they were equal. This one builds that opportunity cost right into the math so the comparison actually means something.
How to Use
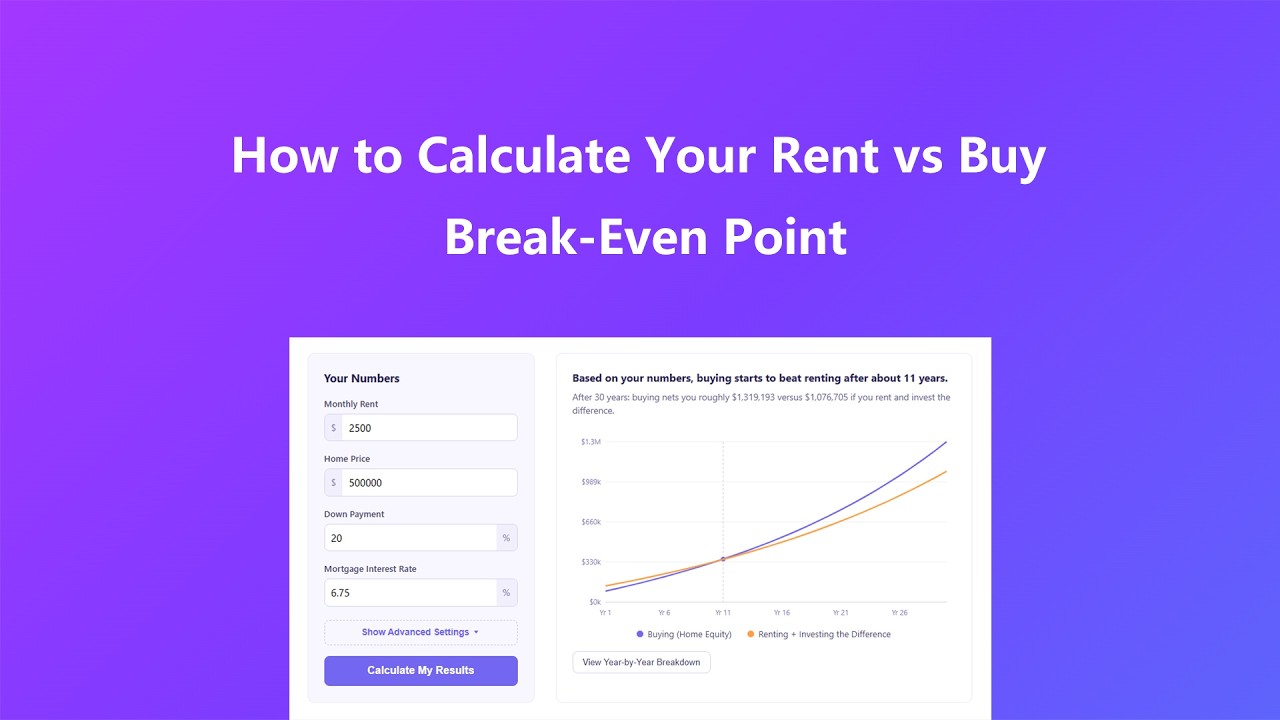
- Start with the basics: your monthly rent, the home price you are considering, your down payment percentage, and today's mortgage rate. That is really all it takes to get a first read on your situation.
- Click "Calculate My Results" and the tool runs the full projection right away, no waiting around and no page reload.
- Want more precision? Open Advanced Settings to fine-tune property tax, HOA costs, home appreciation, rent increases, and the return rate you would expect if that down payment were invested instead.
- Scroll down to the chart to see exactly where the buying and renting lines cross, that crossing point is your break-even year, and open the year-by-year table below it for the full numbers behind the chart.
Key Features
- Break-even point calculation tells you the specific year buying starts to outperform renting, instead of a vague yes-or-no answer that does not hold up under real numbers.
- Built-in opportunity cost math accounts for what your down payment and closing costs could earn if they were invested in the market instead of tied up in a house.
- A live net worth chart plots both scenarios side by side across up to 30 years, so you can see the full trajectory at a glance instead of squinting at a single number.
- Advanced controls let you dial in property tax, home appreciation, rent growth, inflation, and expected investment returns to match your actual market and situation.
- Every calculation happens instantly in your browser, so you can test a dozen different scenarios in less time than it would take to open a spreadsheet.
Common Use Cases
This rent vs buy calculator gets used in a lot of different situations, not just by first-time buyers weighing their first offer:
- Deciding whether to buy your first home or keep renting while home prices and interest rates are still moving around.
- Comparing a specific listing against your current rent to see if the numbers actually hold up before you write an offer.
- Figuring out how large a down payment you would need to make buying worthwhile within a certain number of years.
- Testing how a higher mortgage rate or a bigger HOA fee shifts your break-even timeline before you sign anything.
- Running the math before relocating to a new city where rent and home prices do not follow the pattern you are used to.
Frequently Asked Questions
Does this calculator account for the money I would save by not buying?
Yes. If you choose to rent, the calculator assumes your down payment and closing costs go into an investment account instead, and it factors in the expected return on that money over time. That opportunity cost piece is exactly what most rent vs buy tools leave out.
What return rate should I use for the investment comparison?
The default is set near a long-term historical average for a broad stock market index, but you can change it in Advanced Settings to match whatever return you would realistically expect from your own investments.
Why does buying look worse in the first few years even with a decent rate?
Closing costs and the early years of a mortgage, where most of your payment goes toward interest rather than principal, weigh against you early on. It typically takes several years of home appreciation and equity buildup before buying catches up to renting and investing.
Does the tool include property taxes and maintenance costs?
Yes, both are included and can be adjusted in Advanced Settings. Property tax is calculated as a percentage of your home's value each year, and HOA, insurance, and upkeep costs are added on top and adjusted for inflation.
Is my information saved anywhere?
No. Every calculation runs directly in your browser using the numbers you type in. Nothing you enter into this tool is sent to or stored on our servers.
Advanced Tips
A few ways to get more out of this calculator once you have the basic numbers down:
- Run the numbers with a couple of different mortgage rates side by side, since even half a percentage point can shift your break-even year by a year or more.
- If you are unsure what appreciation rate to use, check recent home value trends for your specific zip code instead of leaning on a national average that may not reflect your market.
- Bump the investment return rate up and down to see how sensitive your break-even point really is to market performance, this shows you how much risk you are actually taking on by picking one option over the other.
- Do not skip the advanced settings if you plan to stay put for ten or more years. Small differences in rent growth or inflation compound significantly over a decade or longer.