Graphing Calculator Online
Graphing functions online instantly with our free interactive graphing calculator. Plot multiple equations, find intersections, and analyze curves. 100% client-side and free.
Functions
What is This Tool
Most graphing tools online are basically a plotting script with an ad banner bolted on. This one is built to actually work the way you think: type an equation, hit enter, and it shows up instantly on a canvas you can drag and zoom through like a real app. It reads standard function notation such as y = x^2 - 4x + 3, implicit equations like x^2 + y^2 = 25, and expressions built with sqrt, abs, ln, sin, cos, and tan.
What sets it apart is what happens under the plotting. Roots, intercepts, and intersections get located automatically with a bisection routine running quietly in the background, so you are not squinting at a grid trying to guess where a curve crosses zero. Drop a constant like a or b into your equation and a slider shows up on the left, letting you stretch, shift, or flip the graph in real time without retyping a thing.
How to Use
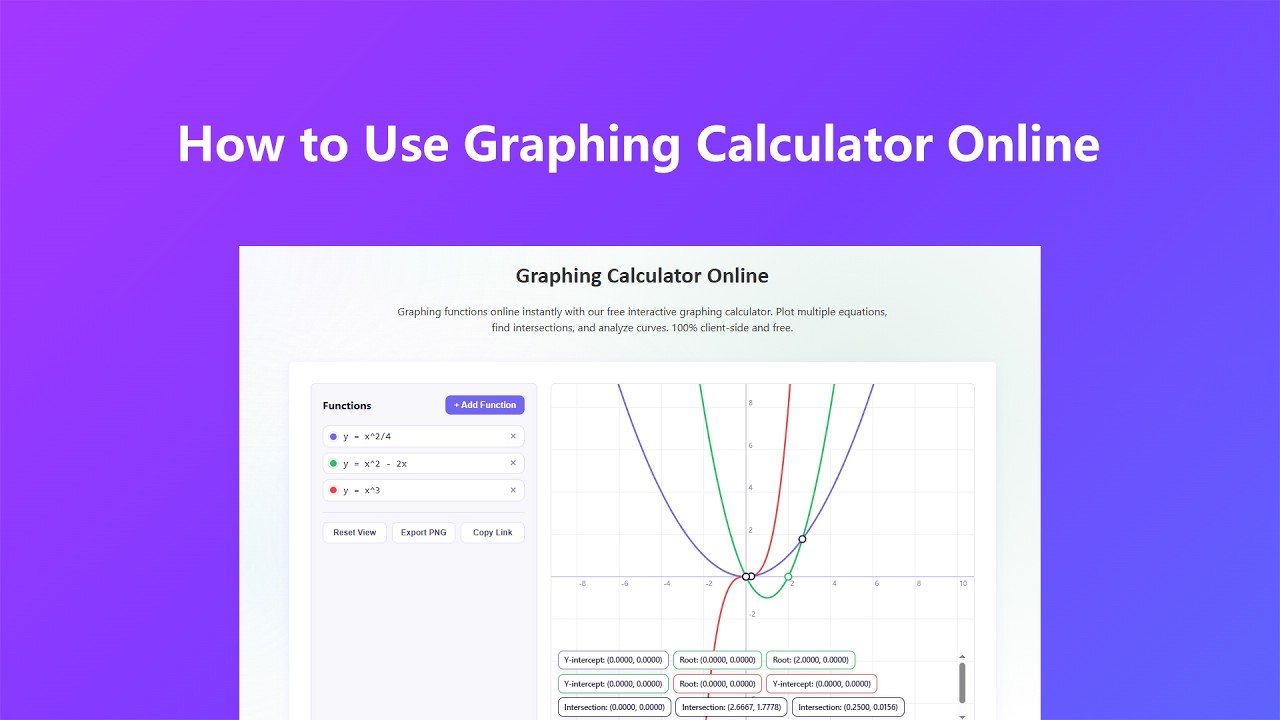
You do not need a manual for this, but here is the rundown so you get the most out of it:
- Type an equation into the input box using standard notation, things like x^2, sqrt(x), or sin(x), then press Enter or click away from the box to plot it.
- Click "+ Add Function" to graph more than one equation at a time. Each one gets its own color so you can tell curves apart at a glance.
- Drag anywhere on the canvas to pan around, and scroll or pinch to zoom in and out. The grid lines and axis numbers update on their own as you move.
- If your equation has a letter like a or b in it, a slider appears automatically on the left. Drag it and watch the curve stretch, shift, or flip without touching the keyboard again.
Key Features
- Multi-equation plotting with color-coded curves, so you can graph y = x^2 right next to y = sin(x) and still tell them apart at a glance.
- Implicit equation support for things like x^2 + y^2 = 25, not just functions written in the standard y = form.
- Automatic root, intercept, and intersection detection using numerical methods, with coordinates shown out to four decimal places.
- Live parameter sliders that appear the moment you use an unknown constant, which makes it genuinely useful for showing how a graph changes as a number changes.
- Smooth pan and zoom built entirely in the browser, plus a trace cursor that follows your mouse and reports the exact coordinate under it.
Common Use Cases
People end up here for all sorts of reasons, but a few come up over and over:
- Homework and test prep, when you need to check a graph fast instead of sketching it by hand and hoping it holds up.
- Teaching a class or tutoring a student, dragging the a and b sliders live to show how a parabola or sine wave actually behaves.
- Comparing two or three functions side by side to spot exactly where they cross or start to pull apart from each other.
- Double-checking a root or intercept you worked out by hand before you write the answer down on an exam.
- Putting together visuals for a worksheet, slide deck, or paper, then exporting the graph as an image once it looks right.
Frequently Asked Questions
Do I need to create an account to use this?
No. There is no sign-up, no login, and no paywall. You type an equation and it graphs, that is the whole flow.
What equation formats does it understand?
Standard function notation like y = x^2 - 4x + 3, implicit equations like x^2 + y^2 = 25, and expressions using sqrt(), abs(), ln(), sin(), cos(), and tan(). Use the caret symbol for exponents, so x^2 means x squared.
How does it find roots and intersections?
It samples your curve across the visible window and uses a bisection method to zero in on where a curve crosses the x-axis, or where two curves meet, refining the answer down to four decimal places.
Can I graph more than one equation at the same time?
Yes, click "+ Add Function" for as many as you need. Each equation gets its own color on the input list and on the canvas, so things stay easy to read even with several curves on screen.
Does anything I type get sent to a server?
No. Every calculation, plot, and slider update runs locally in your browser. Nothing about your equations gets stored or sent anywhere.
Advanced Tips
A few things that make a real difference once you get past the basics:
- Use a single letter like a, b, or k as a constant in your equation and a slider shows up on its own, no setup needed on your end.
- Click directly on a highlighted root or intersection point to see its exact coordinates instead of estimating from the grid lines.
- If a curve wanders off-screen, hit "Reset View" instead of scrolling around blindly trying to find it again.
- Export your graph as a PNG once it looks right, so you can drop it straight into a slide deck or a homework write-up without needing a screenshot tool.