Options Profit Calculator
Calculate and visualize your options trading profits and losses instantly. Interactive visual payoff matrix for Calls, Puts, Spreads, and advanced strategies. 100% client-side and free.
Trade Inputs
Payoff Diagram
Profit / Loss Matrix
What is This Tool
Most options calculators online give you a single number and call it a day. This one is built more like the risk tab on a trading platform. Pick a strategy, drag a slider, and watch the payoff line, the Greeks, and the profit grid all shift together in real time. There's no spreadsheet to build and no Black-Scholes formula to remember, the math runs quietly in the background the moment you touch an input.
What makes this useful for actual trading decisions is the side-by-side comparison between your position at expiration and your position right now, today, with time value still on the table. A long call can look fine on the expiration line and still be losing money this week because of theta decay, and that gap is exactly what catches people off guard. Seeing both curves on one chart removes the guesswork.
How to Use
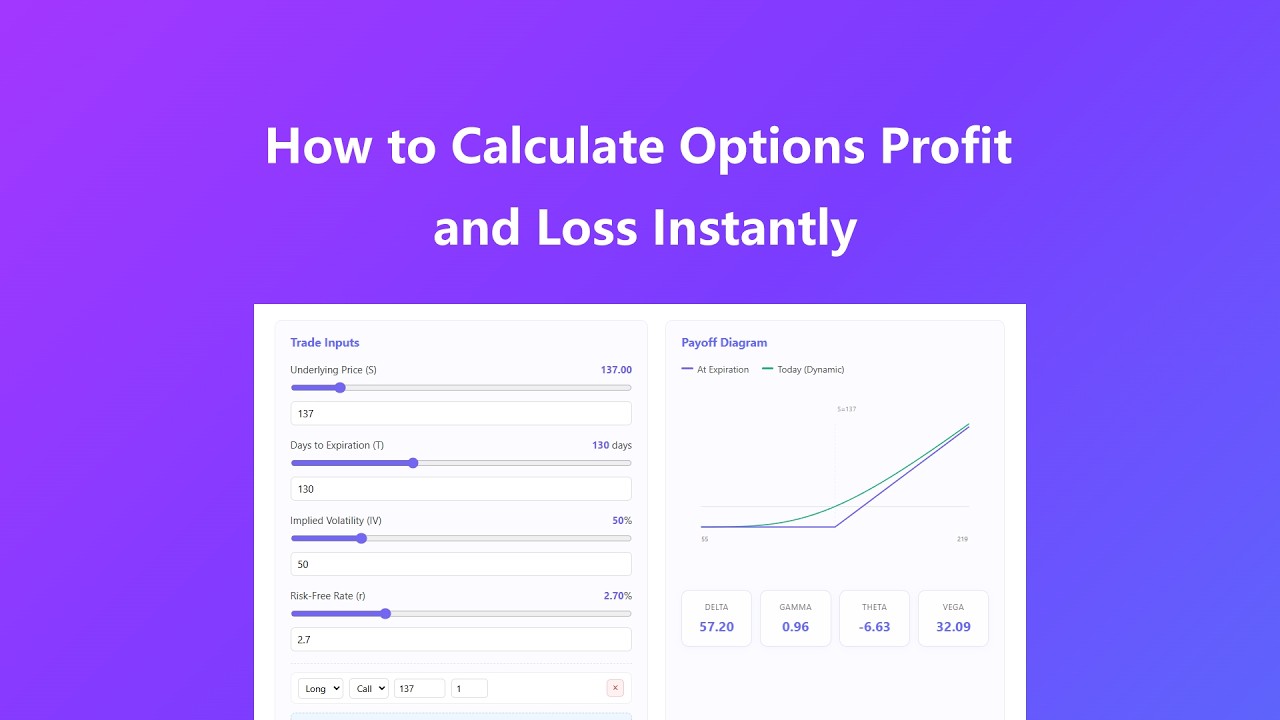
- Click a strategy chip up top, like Bull Call Spread or Iron Condor, and the right number of legs, strikes, and positions load automatically so you're not setting each one up by hand.
- Drag the underlying price, days to expiration, IV, and rate sliders, or just type a number directly into the boxes if you already know your exact entry conditions.
- Watch the payoff chart redraw itself instantly, the purple line is your value at expiration and the green line is what the position is worth right now with time still left on the clock.
- Scroll down to the P/L matrix to see how your trade behaves across a range of price moves and across different points in time, which is the same kind of grid a desk trader checks before sizing a position.
Key Features
- One-click strategy presets cover single legs, vertical spreads, iron condors, straddles, strangles, and covered calls, so you can model a real trade structure in seconds instead of building it leg by leg.
- A dual-line payoff diagram plots both the expiration value and the current theoretical value on the same axis, making time decay visible instead of theoretical.
- A color-coded profit and loss matrix maps price swings from negative ten percent to positive ten percent against time decay, with greens and reds shaded by how big the gain or loss actually is.
- Delta, Gamma, Theta, and Vega update on every keystroke using a full Black-Scholes implementation written in plain JavaScript, no server round trip and no lag.
- Custom legs let you stack additional calls or puts on top of any preset, so you can stress test odd structures or adjust strikes that don't match a textbook spread.
Common Use Cases
- Checking a spread before you place it, so you know the exact breakeven, max profit, and max loss instead of estimating it in your head while the order ticket is open.
- Stress testing a position against a volatility spike or crush, useful right before earnings when implied volatility can swing hard in either direction within hours.
- Comparing strike selection on a credit spread, sliding the short strike around to see how much premium you're actually trading off against assignment risk.
- Visualizing theta decay on a long option over the coming weeks, which helps answer the common question of whether to hold through the weekend or close early.
- Teaching or learning the mechanics of options strategies, since seeing the curves bend in response to a slider is a faster way to build intuition than reading formulas alone.
Frequently Asked Questions
Does this tool place real trades or connect to my brokerage?
No, it's a standalone modeling tool. It never connects to a broker, never holds an account, and doesn't place or suggest live orders. It's strictly for working out the math before you decide what to do in your own platform.
What pricing model is being used under the hood?
The calculator uses the standard Black-Scholes model for European-style pricing and Greeks. It's the same baseline framework most retail platforms use for theoretical value, though American-style early exercise and dividends are not modeled here.
Why does my position show a loss today even though the expiration line looks profitable?
That gap is time value. The expiration line only counts intrinsic value, while the today line still includes the premium tied up in time and volatility, which erodes as days pass even if the stock hasn't moved at all.
Is my position data saved anywhere or sent to a server?
No. Every input, every leg, and every calculation stays in your browser's memory and disappears the moment you close or refresh the page. There's no login, no tracking, and nothing stored server side.
Can I build a strategy that isn't in the preset list?
Yes, start from the closest preset and use the Add Custom Leg button to stack extra calls or puts at whatever strikes and quantities you need. The chart and Greeks recalculate automatically as you adjust each leg.
Advanced Tips
- Before earnings, pull the IV slider up to where the options are currently pricing the move, then pull it back down to a normal level after the print to see how much of your premium was pure volatility risk.
- On credit spreads, watch Theta and Vega together rather than alone, a wide iron condor often has flattering Theta but ugly Vega exposure if volatility expands unexpectedly.
- Use the P/L matrix instead of the chart alone when comparing two strike choices side by side, the actual dollar shading at specific price points makes the tradeoff more concrete than a curve.
- When modeling a covered call, slide the strike toward and away from the current price to see exactly where the call premium stops compensating you for capping your upside.